How High Will The Gold Recovery Go?
Gold is bouncing back, but it remains to be seen how high it will go. The SPDR Gold Shares ETF (NYSE: GLD) is up 4.84 percent in the past month. Gold had dropped over 29 percent from the first of the year, reaching a 52-week low of $114.68 on June 28th. The yellow metal has rallied back over 17 percent from this low. The question is whether the rally will continue. Not surprisingly, analysts are divided on that point.
Morgan Stanley analysts believe the rally is short lived. They contend the gold market has already priced in an announcement that the Fed will reduce its monthly bond purchased at its next meeting. The FOMC is scheduled to meet on September 18th and 19th. The Morgan Stanley analysts point to a couple of fundamental factors which fueled the rebound. They site an exhaustion in ETF sell offs and stronger physical demand in China and India. They further believe the current rally will be limited by a stronger U.S. dollar and higher bond yields. Technically, the analysts stated the price would have trouble breaking through the 100 day SMA.
JP Morgan analysts are taking the opposite side of that prediction, indicating gold will continue to rise. The bank released a note a couple of weeks ago saying the market had shrugged off the news that Paulson & Co. reduced its gold exposure by half. The most recent 13F filing from John Paulson’s firm states it sold off 11 million shares of GLD, leaving a position of 10.23 million shares with a market value of $1.22 billion. JP Morgan analysts pointed to a strong positive seasonality trend in the metal which coincides with the Denver gold conference, predicting a strong run-up to the show. The Denver Gold Forum is scheduled for September 22nd to 25th. They advised that short term investors should go long gold with a 4 to 5 week time horizon. They further pointed to strong physical demand in India and China as bullish, similar to the Morgan Stanley analysts.
Paulson was not the only hedge fund manager leaving the gold party. Soros Fund Management sold off its last 530k shares in GLD according to the firm’s most recent 13F filing. A year ago, Soros had a position of 884k shares with a market value of $137 million. Soros became publicly bearish on gold after the Cyprus banking meltdown, indicating the metal was no longer a holder of value in the face of financial deterioration. Overall, the GLD has had substantial outflows of funds year to date.
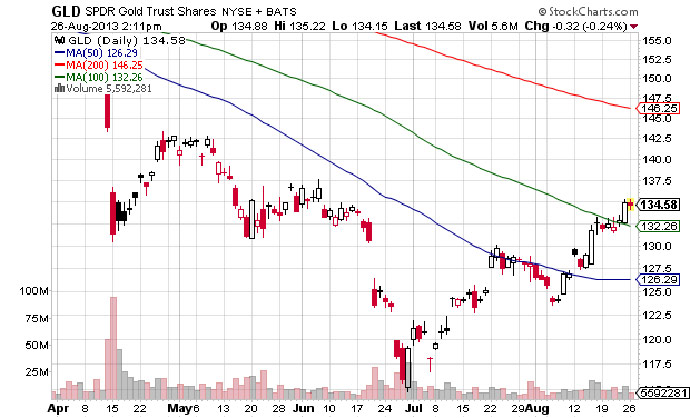
The GLD chart shows the price moving in a narrow upward channel since August 6th. The price broke through the 100-day SMA on strong volume on August 23rd, invalidating at least a portion of the Morgan Stanley prediction. If the lower level of the channel is broken, the price could be headed down to at least $130. Volume has generally been moderate since the bottom at the end of June. GLD is trading with a beta of -2.16, showing a strong inverse relationship with the overall market.
The Market Vectors Gold Miners ETF (NYSE: GDX) has had a more substantial rebound, up over 10 percent in the past month. GDX has traded more volatile than GLD with a beta of -4.16, but has rallied over 36 percent since a 52-week low of $22.21 on June 28th. Similar to GLD, Soros Fund Management exited its position in GDX by selling off 2.66 million shares, as shown by its second quarter 13F filing.
The analysts are in disagreement on where gold is going, pointing to differing fundamental and technical factors that will influence future price action. From the GLD chart, it looks like the recent strong rally could be broken at any time. Further, the volume on the rally has not been that high, which suggests it could turn around at the drop of a hat. Likely, larger macro-economic factors will influence where GLD heads from here.
Disclosure: The author has no position in any of the companies mentioned, and does not intend to initiate a position in the next 72 hours.