HP’s Guidance Gives Its Stock Price a Boost
Image via Flickr/ Ferran Rodenas
HP surprised market participants with guidance that was better-than-expected despite posting declining earnings and sales. Meg Wittman is still relatively new as the CEO and will be given some time to report upwardly-trending earnings. Her mission at the moment is stabilization. It’s hard to imagine a company that derives its revenues mainly from a commoditized business such as hardware could experience significant year-over-year increases in sales and revenue.
HP, the PC and printer giant, reported net profits of 87 cents a share in its second quarter, down 11 percent compared to a year ago and 6 cents better than analysts’ expectations. HP (NYSE:HPQ) sales fell 10 percent to $27.6 billion versus consensus estimates of $28 billion dollars. Guidance for the third quarter estimates earnings of 84 to 87 cents per share compared to estimates of 83 cents per share.
Not only is the current quarter’s EPS lower, but the three-year EPS change rate is also lower by 5 percent. The three-year growth rate at -2 percent is better than the current change, but does not project a profitable company. The dividend yield is an attractive 2.4 percent, with a price-to-earnings ratio of six. With debt at 97 percent and a profit margin of 8.5 percent, the most attractive part of the stock is its low PE.
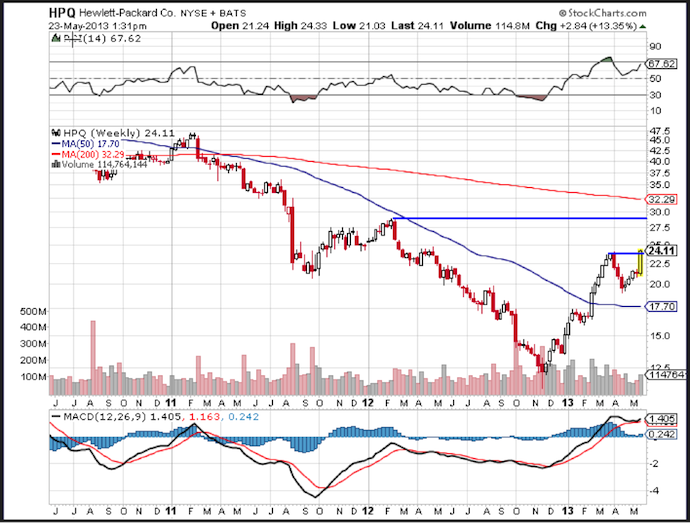
The last time HPQ made a significant move was after its last earnings release. The stock price is gaining traction and could close above weekly resistance near $24.05. Technical analysis indicators seem to be pointing to higher prices, which would be clarified by a close-through resistance. Weekly momentum reflected by a technical study—the moving average convergence divergence index, or MACD—is increasing and recently generated a weekly “buy” signal. This occurs when the nine-week moving average minus the 26-week moving average crosses above the 9-week moving average of that difference.
Another technical indicator—the relative strength index, which measures if a stock is overbought or oversold—is printing at 67, the upper-end of the neutral range. An RSI reading more than 70 would indicate an overbought condition for the stock price.