Strong Housing Data Lifts Housing Stocks

Home builders were buoyed on Tuesday after Case Shiller/S&P released better than expected housing price data. Home prices in March surged more than 10.9 percent year over year, the largest gain seen in the past seven years. Homebuilder stocks surged after the release, but lost some ground as the broader markets retreated from their highs.
According to the Standard & Poor’s Case-Shiller index released during Tuesday morning-trading session, the 20-city housing index increased for the third consecutive month in March. The decline in inventories in major urban areas at the beginning of spring led to the price increase. Prices increased 1.4 percent in March compared to February and showed the first quarter-over-quarter increase since 2006. Home prices in the 20-city index were down more than 28 percent since their peak in 2006, but continue to see traction that could spill over into durable goods orders.
Adding to the positive sentiment was the bump seen in consumer confidence released on Tuesday by the Conference Board. Consumer confidence jumped to 76.2 in May from 69.0 in April. The number was the highest since February 2008, reflecting a strong sentiment.
The question surrounding the recent climb in prices is whether the rally was generated by residential demand or investor purchases. Blackstone, and investment manager, is currently purchasing more than $100 million a week of residential homes, which could distort the real demand picture.
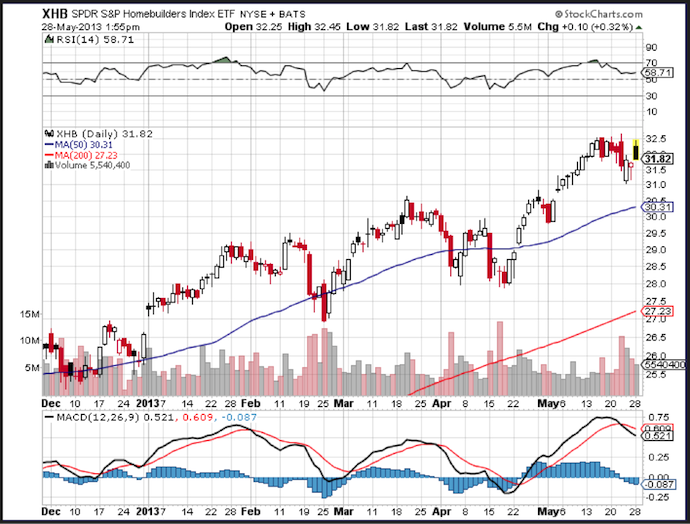
Housing stocks surged after the release of the Case-Shiller data, but slipped back to Earth later in the trading session as the broader markets retreated. The SPDR Homebuilders Index ETF (NYSE:XHB) quickly tested resistance near the 32.50 level but was unable to hold onto its gains.
Momentum on the XHB is negative with the MACD (moving average convergence divergence index) generating a “sell” signal last week as the spread (the 12-day moving average minus the 26-day moving average) crossed below the nine-day moving average of the spread. The MACD index moved from positive to negative territory confirming the sell signal. The trajectory of the MACD is negative which forecasts additional negative momentum for the stock price. The RSI (relative strength index), an oscillator that measures overbought and oversold level, is printing near 58, which is in the middle of the neutral range and reflects the resent consolidation.